
Power BI is an extremely powerful analytical tool that can enhance the reporting capabilities within any organization. Known for its business intelligence enablement and real-time dashboards, Power BI is an integral part of the innovation behind the Microsoft Power Platform. Let’s take a look at four ways Power BI can transform reporting for you.
Current data at your fingertips
Reporting is often time-consuming to gather and provides historical data of past performance. Once data connections are set, Power BI reports can contain up-to-date performance data allowing companies to make impactful business decisions in real-time.
- Automatic Refreshes
- Datasets can have up to eight automatic refreshes per day, unless on premium capacity, which allows up to 48 refreshes per day.
- Direct Query
- When connecting to data, some data types allow for direct query, which loads current data when the report is accessed. With this type of connection report, performance will depend greatly on the performance of the underlying data sources.
- Subscriptions
- Report snapshots can be emailed at defined time periods allowing users to receive data right in their inbox.
End-users can interact with reports
When working with reporting development teams, I hear two main frustrations:
- Everyone wants to see the data slightly differently, which leads to creating more and more reports.
- Those who oversee performance want to know more about what is feeding the numbers, leading to multiple emails, calls or meetings to discuss how to either replicate or avoid the same results in the future.
Power BI allows end-users the ability to interact with the data on a report, so they can view it from multiple angles or drill into the results to discover what is behind the numbers.
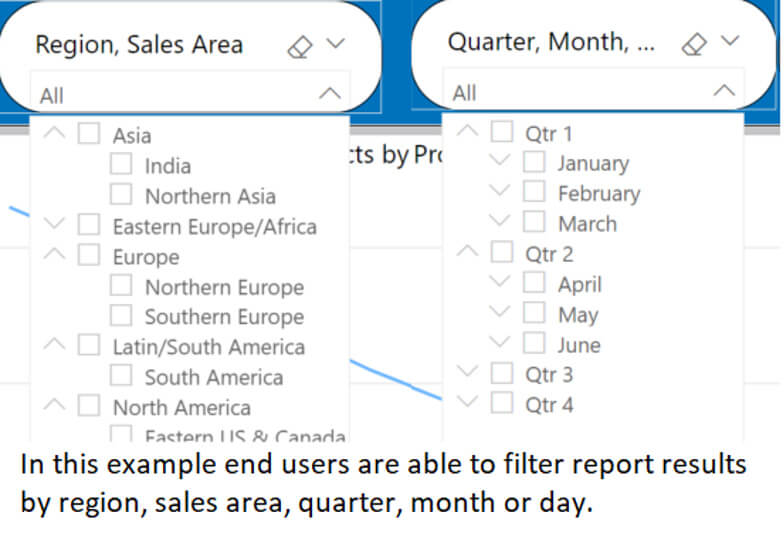
- Filters
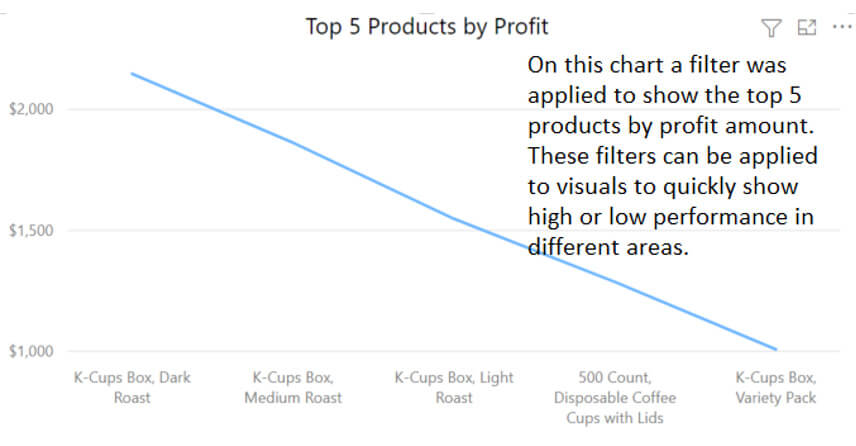
- Use filters to view visuals for different areas within the company, choose particular date ranges, or highlight bottom or top performers within certain data values.
- Use filters to view visuals for different areas within the company, choose particular date ranges, or highlight bottom or top performers within certain data values.
- Drill Down
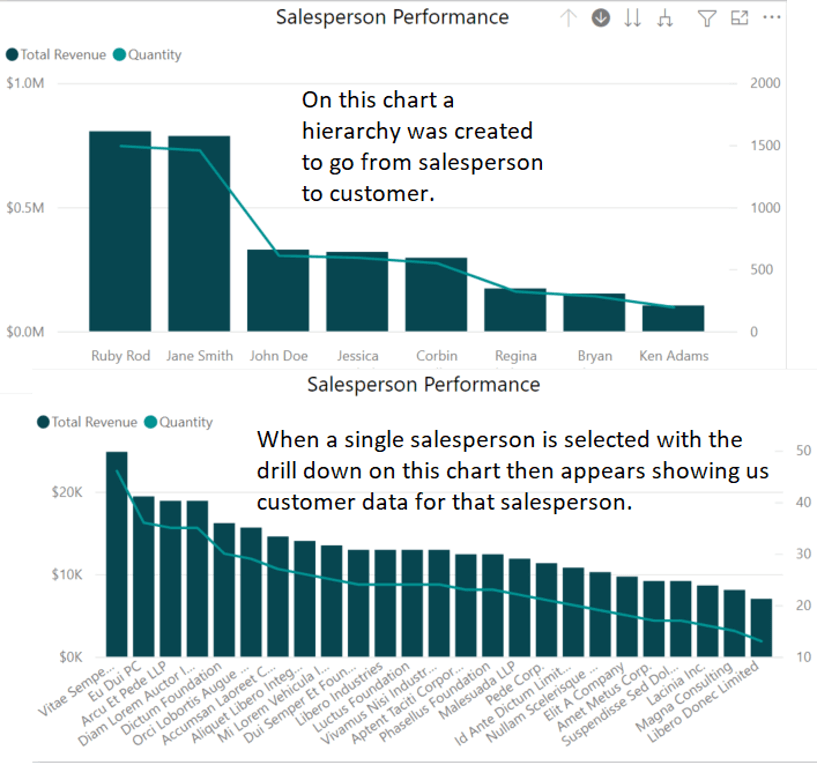
- Create hierarchies to view data at an overall level with the capability to click into subsequent levels of the hierarchy.
- Create hierarchies to view data at an overall level with the capability to click into subsequent levels of the hierarchy.
- Drill Through
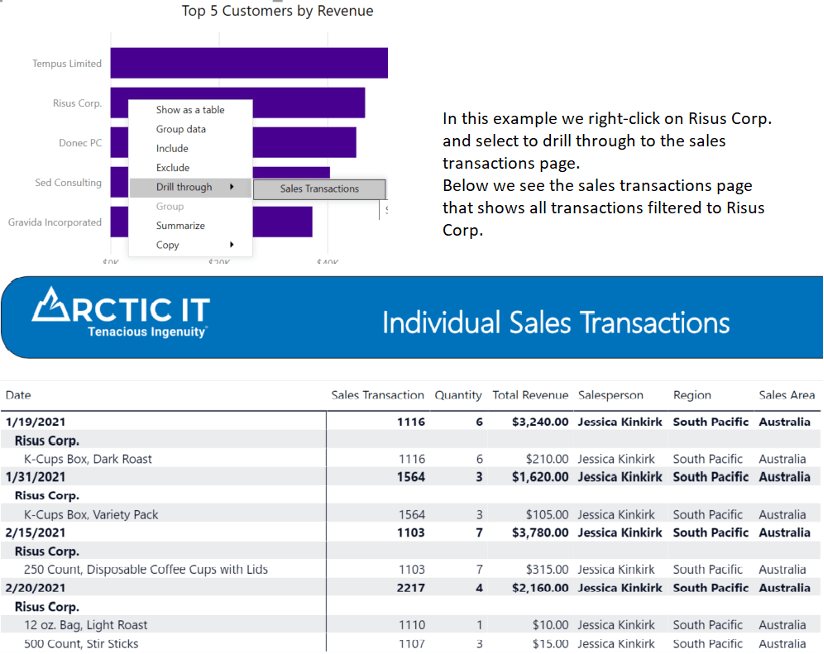
- Create detailed pages that can be accessed from a summary page, allowing end-users to drill into specific information from a singular data point on the report.
- Create detailed pages that can be accessed from a summary page, allowing end-users to drill into specific information from a singular data point on the report.
- Tooltips
- Although not as interactive as others in the list, tooltips can be created to appear when end-users hover over a data point and provide another set of visuals filtered to that particular data point.
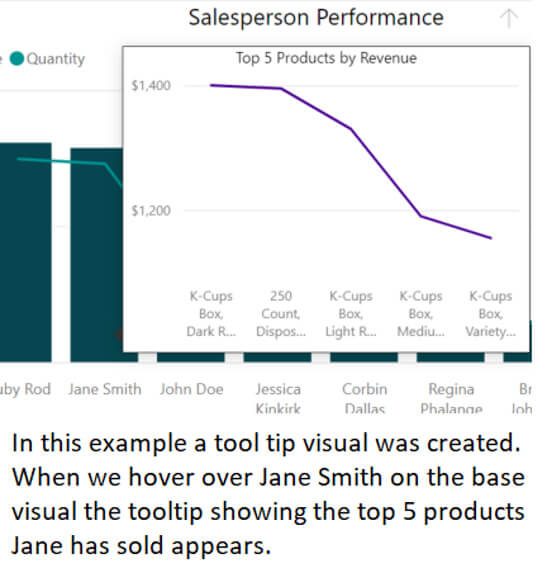
- Although not as interactive as others in the list, tooltips can be created to appear when end-users hover over a data point and provide another set of visuals filtered to that particular data point.
Access to powerful analytical tools
Power BI has quite a few tools for analyzing data to help define trends, potential problems, and quick visuals that show overall performance. These tools can help companies gain faster insight and forecastable data trends to help grow business or increase profitability.
- Calculated Columns
- Use formulas to perform calculations at an individual data row-level or work across data tables.
- Measures
- Use formulas to perform calculations across a subset of data on the report page or individual visual.
- Helpful when using formulas that cannot be calculated at an individual row level or shouldn’t be summarized, counted, or averaged on the report
- Use formulas to perform calculations across a subset of data on the report page or individual visual.
- Trend Lines
- Within basic column and bar charts, there is the ability to add a constant line, min line, max line, average line, median line, or a percentile line.
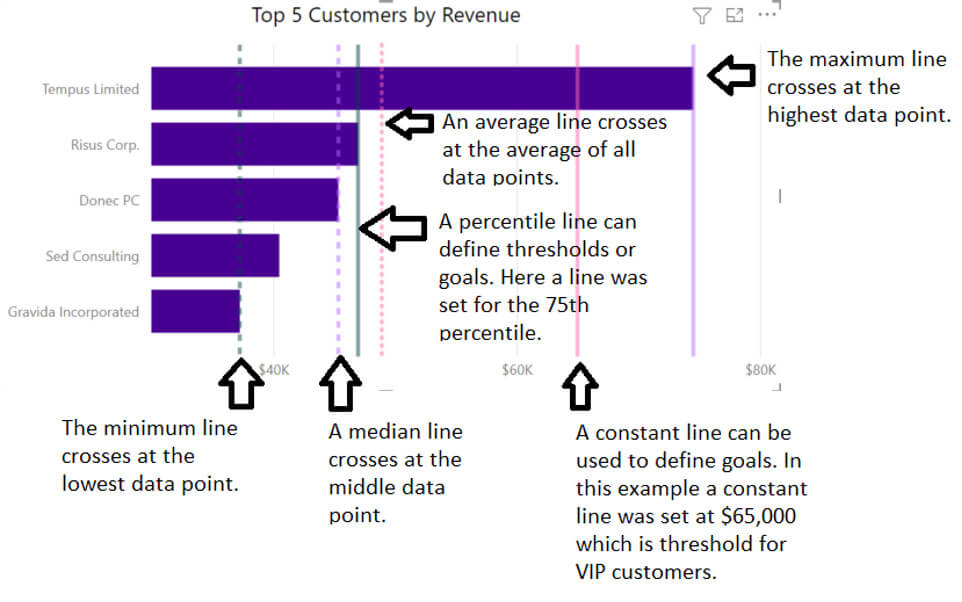
- Within basic column and bar charts, there is the ability to add a constant line, min line, max line, average line, median line, or a percentile line.
- Conditional Formatting
- Conditional formatting allows a report creator to define rules around how the data values appear within specific visuals. This is helpful to draw the eye to potential problems or low and high-performance indicators.
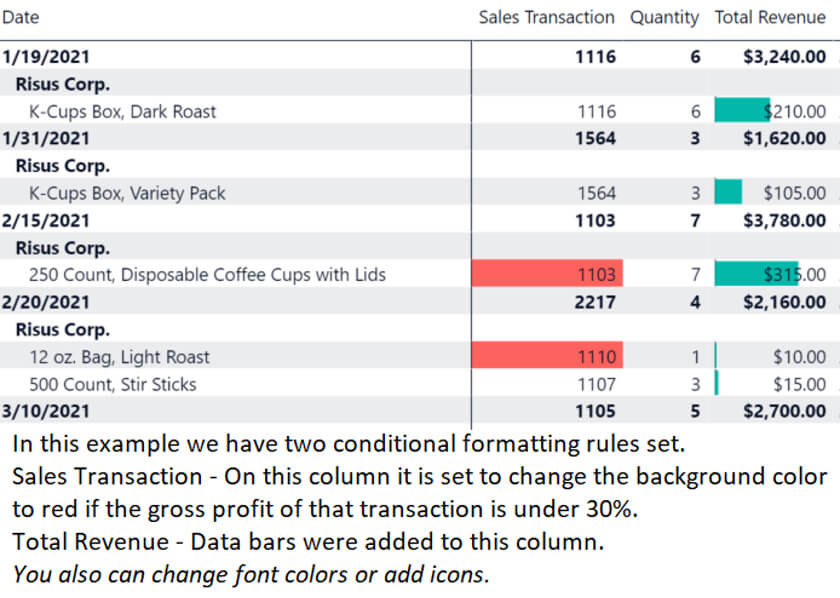
- Conditional formatting allows a report creator to define rules around how the data values appear within specific visuals. This is helpful to draw the eye to potential problems or low and high-performance indicators.
- Q&A
- The Q&A function enables end-users to ask questions about the data set, and Power BI will return a potential visual that can be added the report. If this feature is utilized, the data should be cleaned up and renamed to use the lingo end-users would use, versus schema names as is default in data connections.
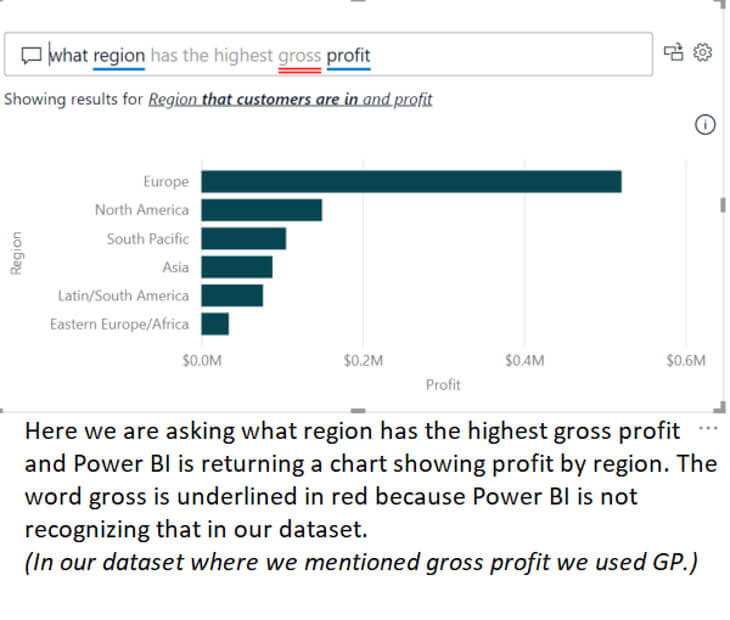
- The Q&A function enables end-users to ask questions about the data set, and Power BI will return a potential visual that can be added the report. If this feature is utilized, the data should be cleaned up and renamed to use the lingo end-users would use, versus schema names as is default in data connections.
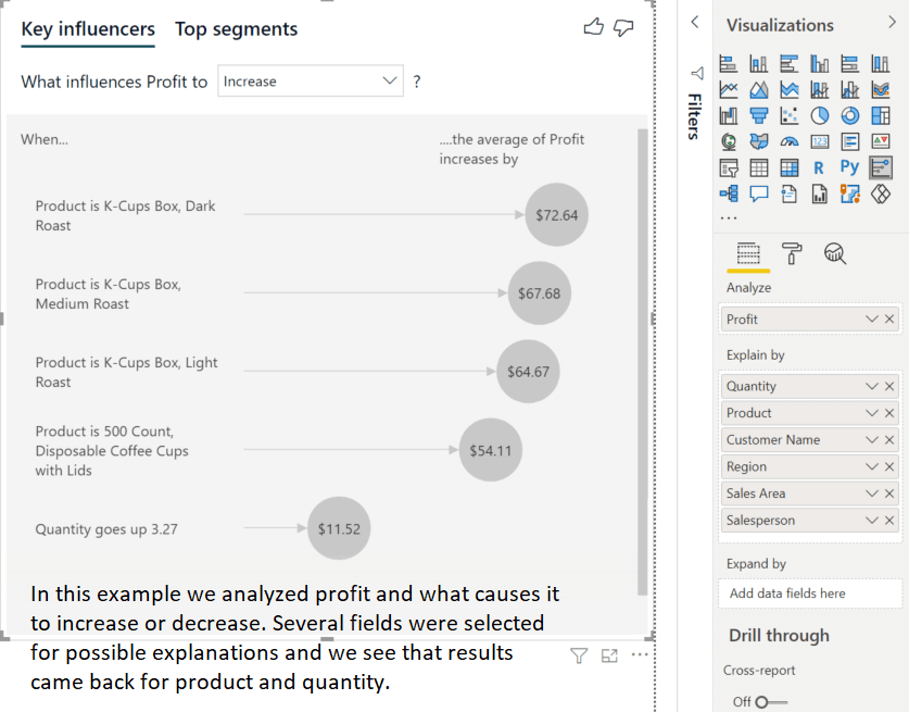
- Key Influencers
- Key influencers take a data point and explain factors that impact the increase or decrease of that data point. When using this, it is important to include lots of ways to explain performance as it can be difficult to receive a correlation between fields.
- Key influencers take a data point and explain factors that impact the increase or decrease of that data point. When using this, it is important to include lots of ways to explain performance as it can be difficult to receive a correlation between fields.
Sharing and collaboration made easy
Multiple options are available for sharing the reports you create for members inside or outside your organization. An important note: End-users will require a Power BI Pro license to access the reports or the reports must be published in a Premium capacity.
- Sharing Individual Reports and Dashboards
- Access can be shared with read-only access, share access or build access. Each user you wish to share with must be added individually and permissions managed separately.
- Workspaces
- Use this if there are multiple reports or dashboards where you want to share and collaborate with multiple end users. Permissions are set at the workspace level, so you do not need to add them separately for each report or dashboard.
- Apps
- Create collections of reports and dashboards that end-users can download to view. This is helpful if end users only need to absorb the data, not collaborate.
- Comments
- Turning on comments allows the team to discuss report data directly on the report versus having to send emails.
- Sharing Datasets
- Datasets can be shared either when sharing an individual report or directly from the dataset. Enabling this allows end-users to build their own reports but uses the shared dataset as a source of truth for everyone.
Power BI is an awesome tool that easily connects to multiple data sources and provides impactful visualizations that can help keep a pulse on company performance. Taking advantage of this service will help free up resources that were previously tasked with gathering, creating and presenting reports. It is definitely worth taking a look into what Power BI can do for you!
Ready to take your business intelligence up a level? Connect with us at [email protected] today.

By Jerica Coleman, Senior Client Services Consultant at Arctic IT